Getting started with Debug 360
Debug 360 records your site's PHP errors and warnings in the WordPress database, where only the people you choose can read them. Normally WordPress writes them to wp-content/debug.log, a file that anyone on the internet can often download.
Install and switch on
- In WordPress, go to Plugins → Add New, search for BlogSafe Debug 360, click Install Now, then Activate.
- Open Debug 360 in the admin menu. The first visit shows a short welcome; click Continue to Settings or open the log.
- In the Debugging Options panel on the left of the log, switch on Enable Debug 360 and click Save Settings.
That also switches on WP_DEBUG and WP_DEBUG_LOG, and switches off WP_DEBUG_DISPLAY, because Debug 360 can't capture fully without them. The status line above the switches confirms it: ● Logging to database.
See it work
Your log may stay empty for a while, because a healthy site has few errors. To check that Debug 360 is capturing, go to Debug 360 → Settings and click Send test errors under Test Debug 360. It takes you to the log. It raises a harmless notice, warning and deprecation, and writes one message to debug.log the way WordPress's own update messages are written. All four appear in the log at once, each labelled Debug 360 test. Nothing on your site breaks. Delete them when you're done, or click Clear Debug Log.
If your Notification Level is Warning or lower, the test warning also sends an alert email, which checks your alerts too. Only administrators see the button, and it can be used once every 10 seconds.
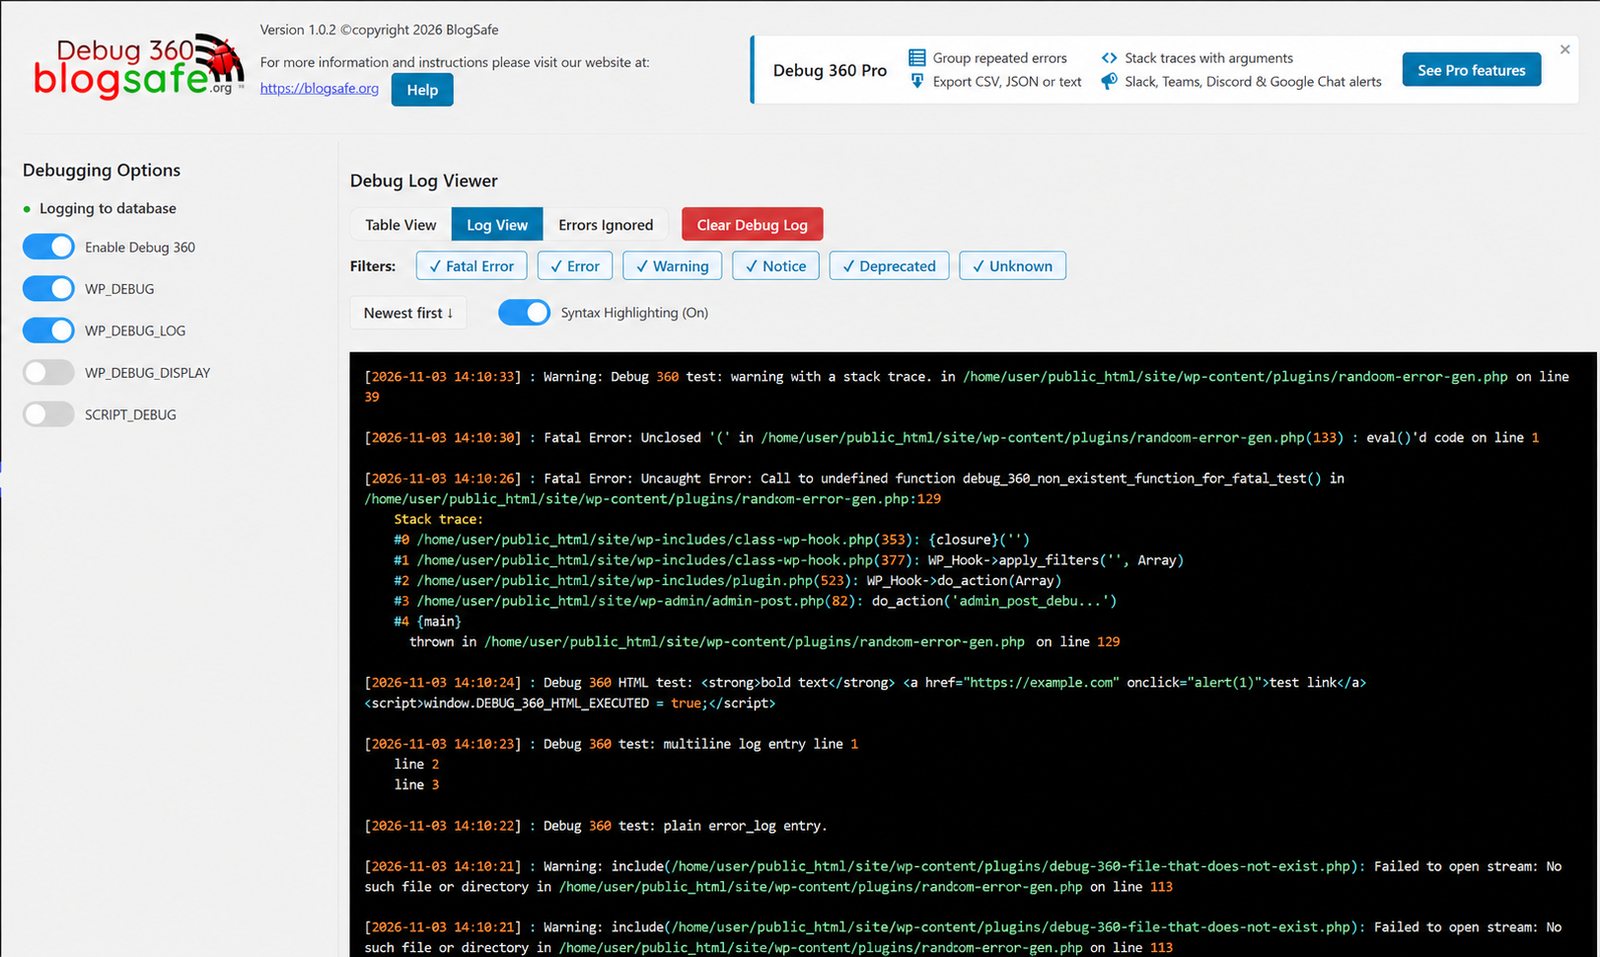
The debugging switches
| Switch | What it does |
|---|---|
| Enable Debug 360 | Debug 360's own error capture. While it's on, errors are saved to the database and are not shown to visitors. Switching it on also switches on WP_DEBUG and WP_DEBUG_LOG, and switches off WP_DEBUG_DISPLAY. |
| WP_DEBUG | WordPress's debug mode. WordPress only raises its own warnings, such as deprecated functions, while this is on. Switching it off also switches off WP_DEBUG_LOG, WP_DEBUG_DISPLAY and Debug 360. |
| WP_DEBUG_LOG | WordPress's own debug.log file. It's how errors from before Debug 360 loads reach it: Debug 360 imports anything written there and then deletes the file. Needs WP_DEBUG. Switching it off also switches off Debug 360. |
| WP_DEBUG_DISPLAY | Shows errors on the page itself. Keep it off on a live site. The status line turns red ("Errors are shown on the site") if errors can be seen. |
| SCRIPT_DEBUG | Makes WordPress load its unminified JavaScript and CSS. Only useful when you're debugging scripts. |
If wp-config.php is read-only, the switches can't follow. Debug 360 still captures errors from the moment it loads, but it misses WordPress's own warnings and anything earlier, and the status line says Capture is incomplete.
Flip the switches you want, then click Save Settings below them. Only administrators can change them.
How Debug 360 changes wp-config.php
The four WordPress switches are lines in your site's wp-config.php file. When you flip one, or switch on Debug 360, it:
- saves a backup of
wp-config.phpbeside it (it keeps the newest three); - records your original settings, the first time only;
- writes the new file in a single step, so a failed write can't leave it half-written.
When you deactivate Debug 360, it puts your original settings back. That way, removing it never leaves WP_DEBUG_LOG writing errors to a public file.
Some hosts lock wp-config.php so WordPress can't change it. Debug 360 then shows the four switches as locked and tells you which lines to change by hand. Enable Debug 360 still works, because it doesn't touch the file.
Reading the log
The log page has three views; switch between them with the buttons above the log.
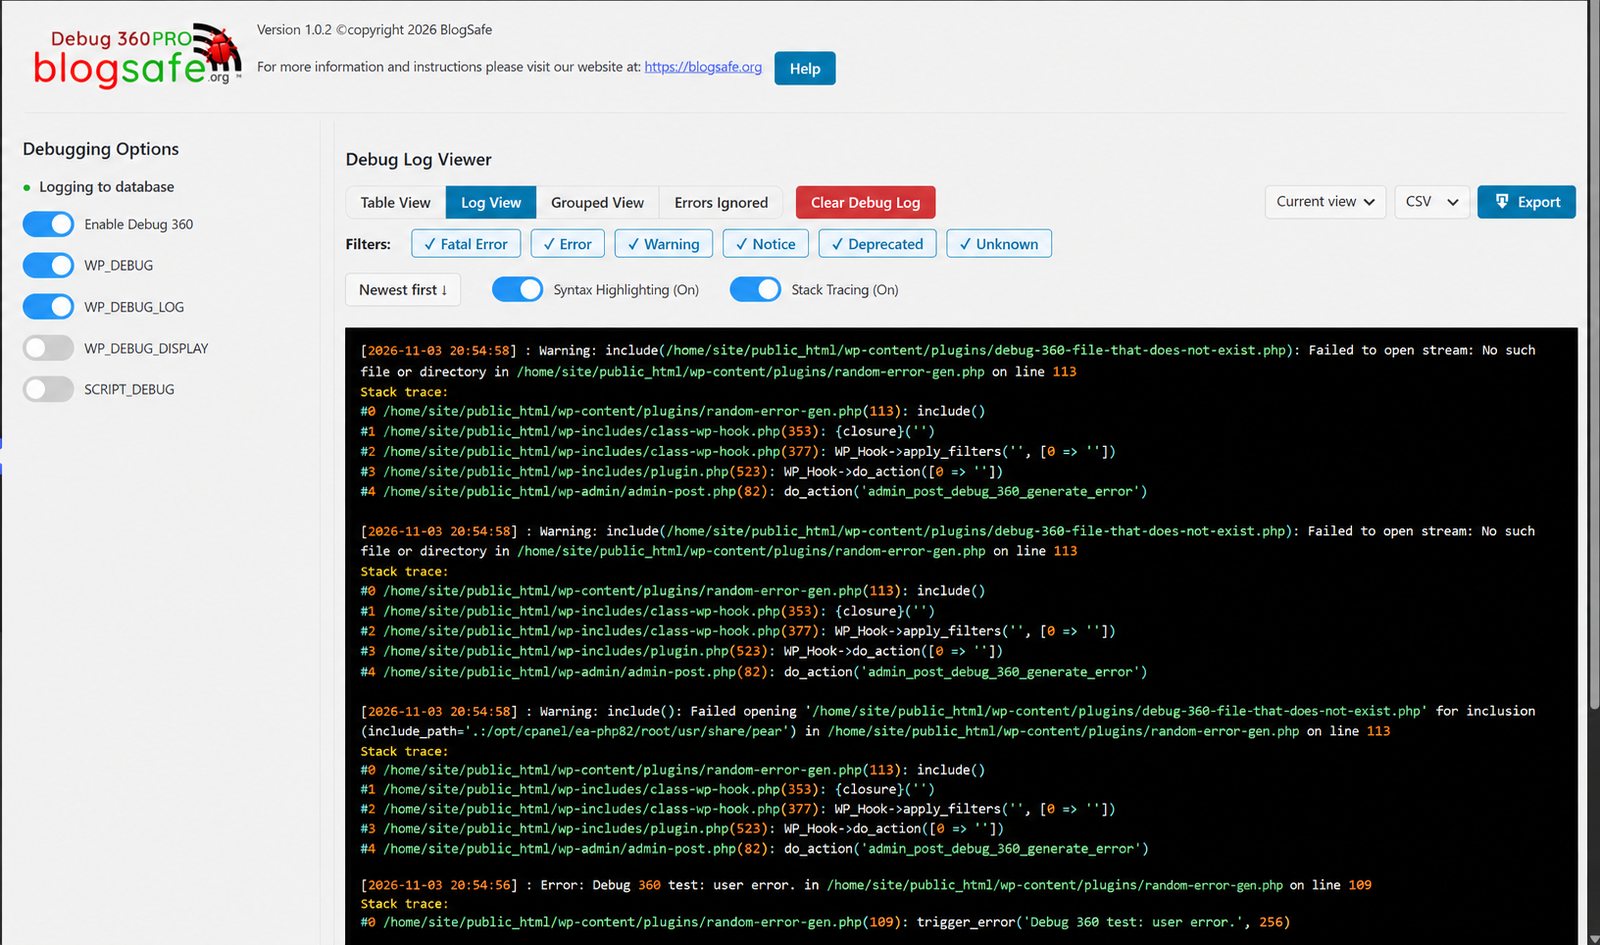
- Log View shows entries as plain lines with colour highlighting, like a log file. Turn the colouring off with Syntax Highlighting if you prefer.
- Table View shows one entry per row with its time and level. Long messages are cut short; click View More to read the whole message. Each row has Delete and Ignore (point at the time to see them), and you can tick several rows and delete them together with Bulk actions.
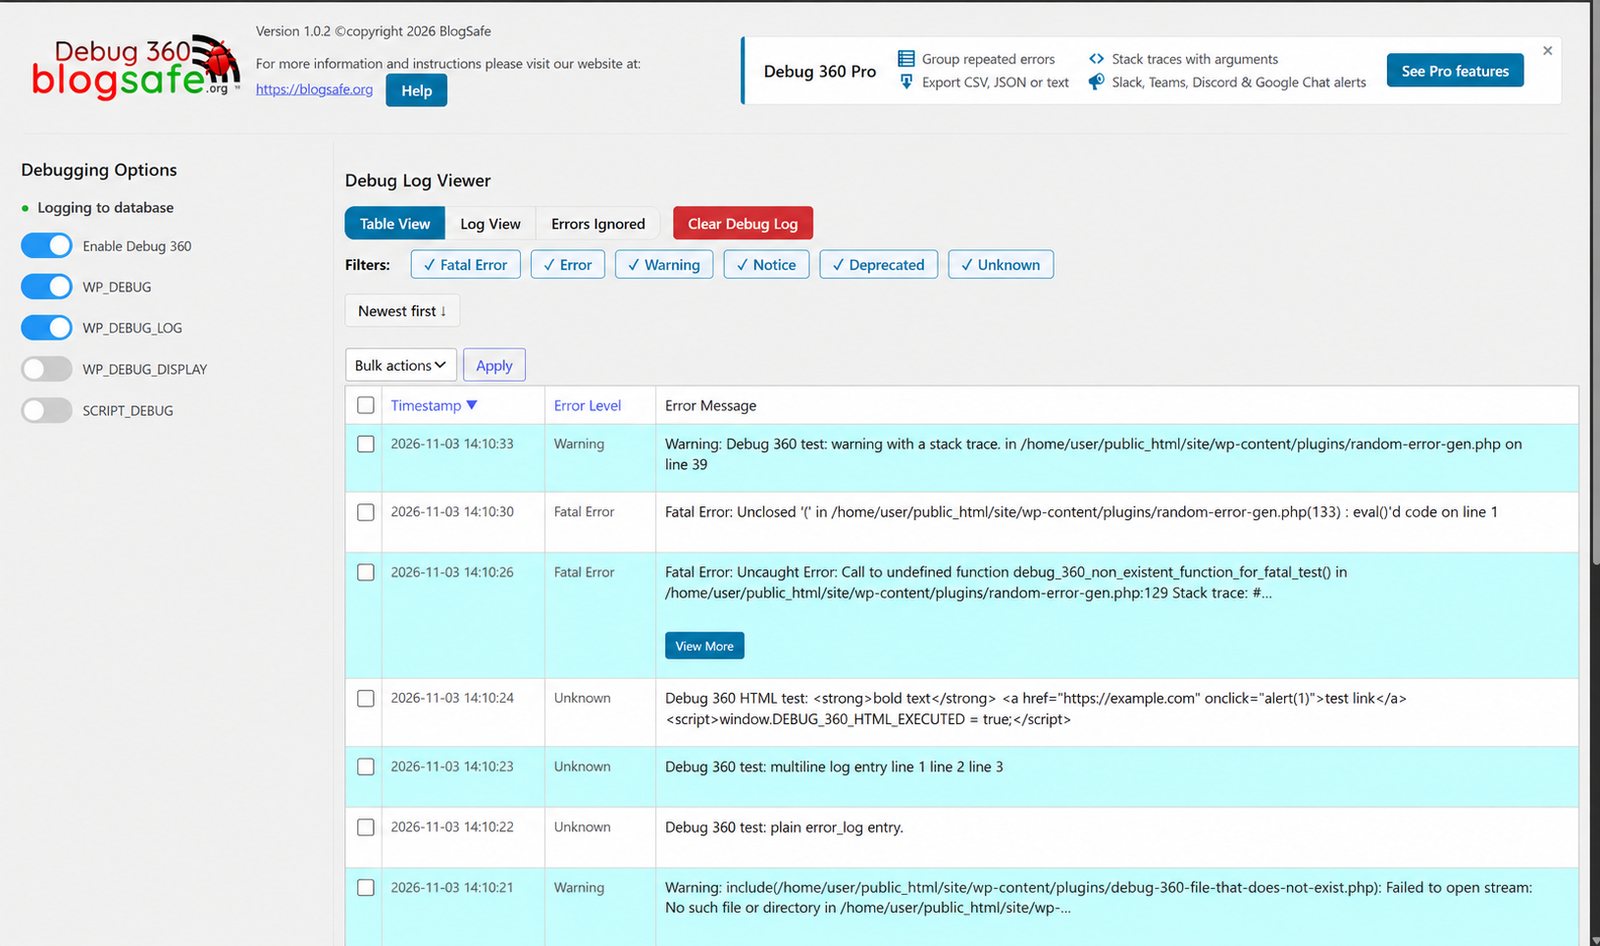
- Errors Ignored lists the messages you've ignored (see below).
Above the log:
- Filters show or hide each level: Fatal Error, Error, Warning, Notice, Deprecated and Unknown. Your choice is remembered.
- Newest first ↓ / Oldest first ↑ reverses the order.
- Clear Debug Log clears the log for a fresh start. It asks first. Cleared entries aren't deleted straight away: switch on History, beside the other switches above the log, to see them again with the new ones. Debug 360 keeps cleared entries for 30 days, and at most 5,000 of them, then deletes the oldest once a day.
- To remove an entry for good, use its Delete link, or tick entries and choose Delete under Bulk actions. That works on cleared entries too, with History on.
Pages hold 20 entries. Use the page links or the Jump to Page slider to move through a long log.
How errors reach the log
Debug 360 has its own error handler and its own shutdown handler. From the moment the plugin loads, every PHP error goes straight to Debug 360 and into your database, and fatal errors are caught by the shutdown handler as the page finishes. Once Debug 360 is running, no PHP error is written to debug.log.
Two kinds of message can still reach debug.log, and Debug 360 collects both:
- Errors from before Debug 360 loads, for example in another plugin that loads first. When Debug 360 starts, in that same page load, it imports
debug.loginto the log and deletes the file. A very large file is imported over a few page loads. - Messages code writes on purpose with PHP's
error_log()function. These aren't errors, so they never pass through an error handler. WordPress itself does this whileWP_DEBUGandWP_DEBUG_LOGare both on, for example Automatic updates starting… and Upgrading plugin… during background updates. Debug 360's shutdown handler imports them at the end of that same page load and deletes the file.
Ignoring errors you can't fix
Some warnings and messages come from code you can't change: other plugins, themes, and WordPress itself, which is chatty about background updates when its debug log is on. Hiding them keeps the log readable.
- Ignore one exact message: in Table View, click Ignore on the entry. Debug 360 stops recording that message and deletes every copy already in the log. It's listed under Errors Ignored, where Delete starts recording it again.
- Ignore anything containing a phrase: go to Debug 360 → Ignores, type the phrase and click Add Phrase. Any new message containing that text, in any letter case, isn't recorded, and entries already in the log that contain it are deleted, cleared ones included. The confirmation says how many. Switching a phrase back on, or editing it, does the same. Phrases can be edited, switched off and on, or deleted. For example, the phrase
wp-content/plugins/old-gallery/ignores every error from that plugin.
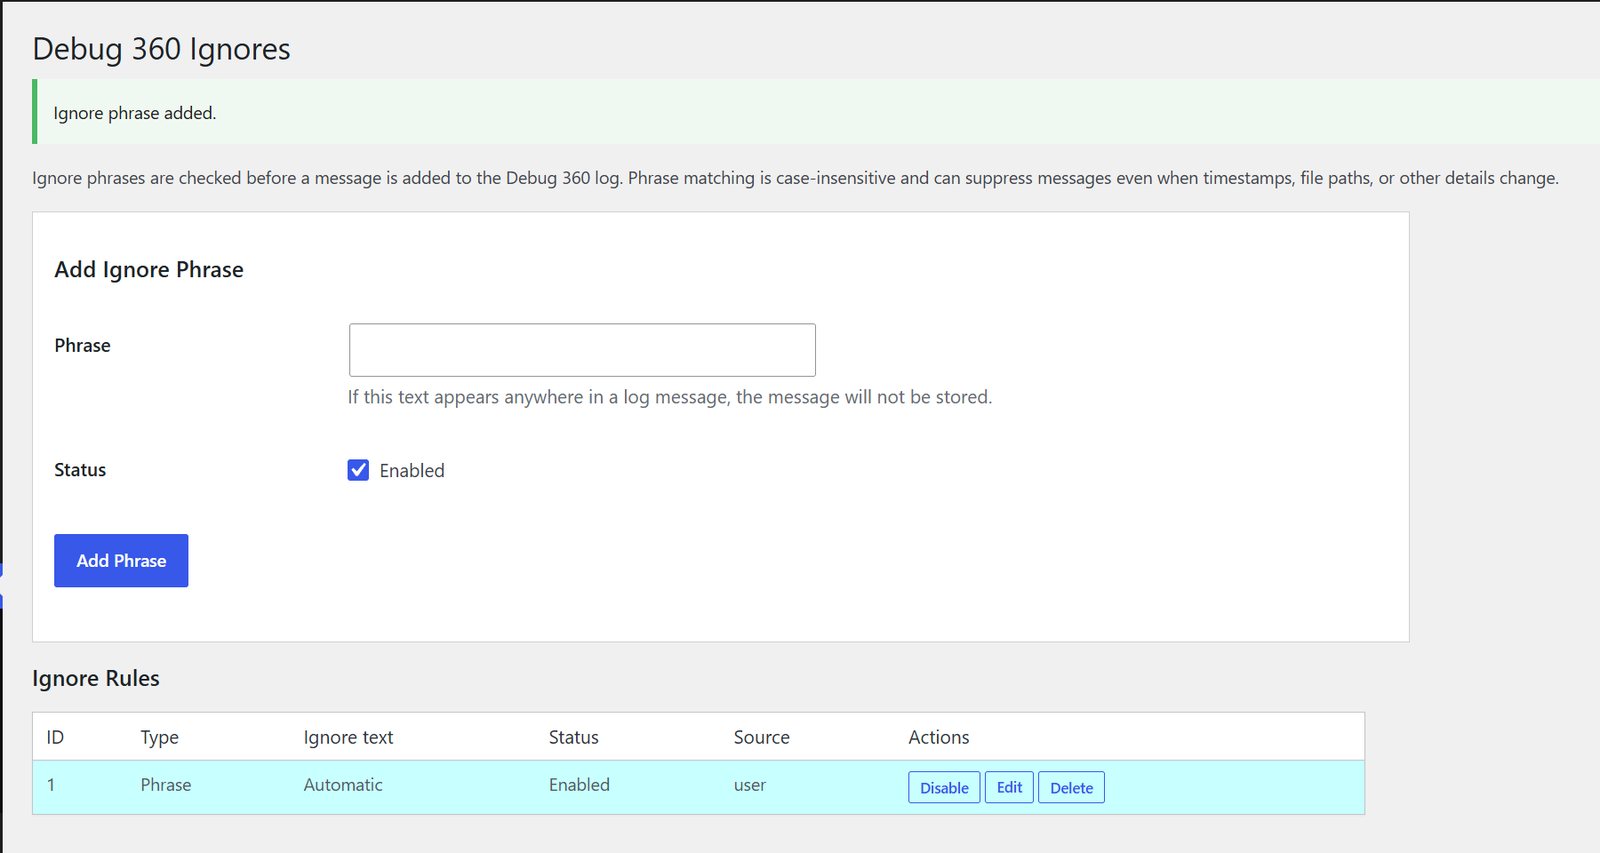
Turning a phrase off, or deleting it, doesn't bring deleted entries back.
Email alerts
Debug 360 can email you when an error happens.
- Go to Debug 360 → Settings.
- Choose the Notification Level: - Error sends errors and fatal errors only. This is the best choice for most sites. - Warning also sends warnings. - Notice also sends notices and deprecation messages.
- Under Email Notifications, tick Enable email notifications.
- In the Send column, tick the users who should get the emails.
- Click Save Settings.
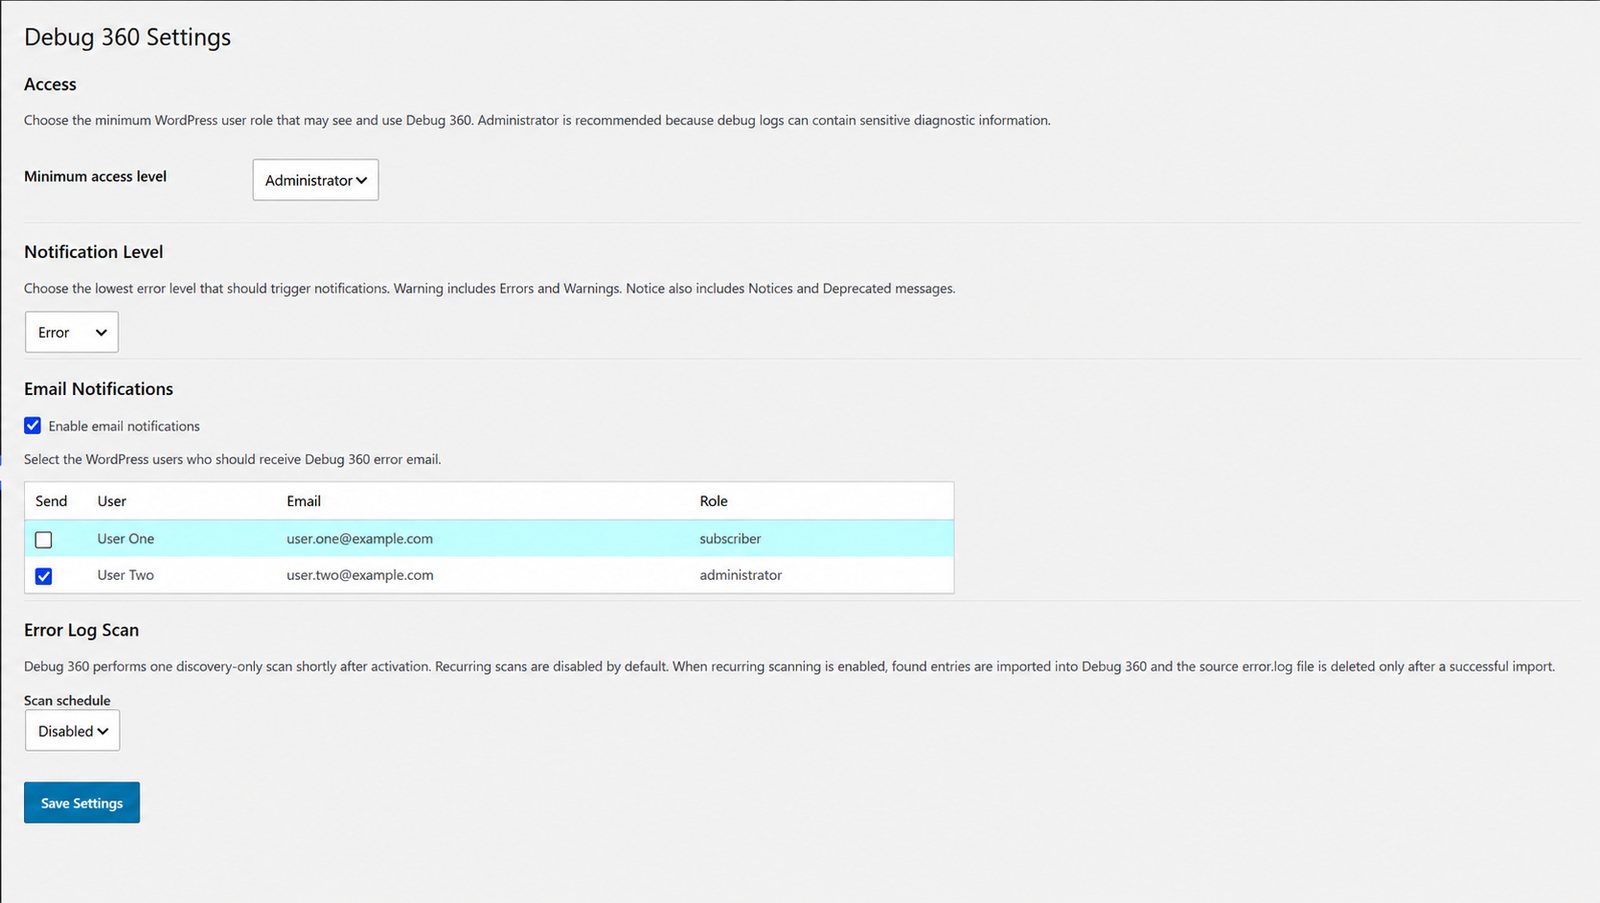
Each email names the site and its address, the error level and the full message.
To avoid floods, the same error is emailed at most once every 15 minutes, and one page load sends at most 10 alerts. Emails go out through your site's normal mail. If they don't arrive, check that your site can send email at all; many hosts need an SMTP plugin.
Finding stray error logs
Many servers write PHP errors to files called error.log or error_log (the name many hosts, including cPanel, use) inside your site's folders. They can be large, they're often public, and nobody reads them.
When you first activate Debug 360, it looks through your WordPress folder for error.log and error_log files. If it finds any, it shows a notice on Debug 360's pages and, if email alerts are on, emails the people who receive them. It doesn't touch the files.
To import them into the log, go to Debug 360 → Settings → Error Log Scan and change Scan schedule from Disabled to Hourly, Daily, Weekly or Monthly. Hourly keeps a freshly written error_log on the server for an hour at most; scans run on WordPress's scheduler, so a site with little traffic can run them later. On each scan, Debug 360 imports every error.log and error_log file it finds, then deletes the file, but only after a successful import. The imported entries start with [Imported from …] and the file's path.
To look straight away, for example after a theme or plugin crashed, click Check now under Error Log Scan. It uses your saved schedule: with a schedule set it imports and removes what it finds, and with Disabled it only lists the files. Check now needs Enable Debug 360 switched on; while it is off, scheduled scans also leave error logs where they are. Deactivating and reactivating Debug 360 also runs the first-time check again, about a minute later.
Floods of the same error. Anyone can make a theme or plugin file crash over and over by requesting it directly, and each crash adds to that folder's error_log. When an import finds the same error many times, Debug 360 stores it once and adds a line such as [Repeated 1249 more times; last at 2026-11-07 10:00:00]. The same applies to debug.log. The log also keeps at most 50,000 entries: once a day, the oldest beyond that are deleted, so a flood can't fill your database.
Who can see the log
Under Debug 360 → Settings → Access, Minimum access level sets the lowest role that can open the log: Administrator, Editor, Author, Contributor or Subscriber. Choosing a role includes every role above it.
Only administrators can change settings, flip the debugging switches or (in Pro) export the log, whatever this is set to.
Error messages can contain file paths, plugin names and text visitors typed. Give access only to people you trust.
Deactivating and uninstalling
- Deactivating stops error capture and restores the
wp-config.phpdebug settings you had before Debug 360 changed them. Your log and settings are kept. - Deleting the plugin (Plugins → Delete) removes its database tables, settings, scheduled tasks, the
wp-config.phpbackups it made (never backups made by hand or by other tools) and any leftover import files.
If wp-config.php has become read-only since Debug 360 changed it, Debug 360 can't restore your settings. It warns you on the Plugins screen and shows the lines to put back by hand.
Troubleshooting
| What you see | What to do |
|---|---|
| Not logging in the status line | Switch on Enable Debug 360. |
| Not sure capture is working | Click Send test errors on Debug 360 → Settings. Four entries labelled Debug 360 test should appear. |
| Errors still appear on the site | Switch off WP_DEBUG_DISPLAY. If your host shows PHP errors itself, ask them to turn off display_errors. |
| The WordPress switches are locked | wp-config.php is read-only. Use the lines Debug 360 shows, or ask your host to make the file writable. |
| A message is missing from the log | Check Errors Ignored and Debug 360 → Ignores, and the level Filters above the log. |
| No alert emails arrive | Check the Notification Level and the chosen users, and that your site can send email. The same error is emailed at most once every 15 minutes. |
A debug.log file keeps appearing |
Debug 360 imports and deletes debug.log every time it starts, including anything written earlier in the same page load. Its shutdown handler imports and deletes it again at the end of the page load, which catches messages written with error_log(), such as WordPress's background-update messages. A file that stays was written after that, or when Debug 360 couldn't run or save: a plugin's own end-of-page code that runs after Debug 360, a page load that ended in a fatal error, a page load that failed before plugins loaded (such as a database connection error, or a fatal error in wp-config.php or a must-use plugin), or errors written while the database was unavailable. It's all imported on the next page load. If it keeps coming back, check that Enable Debug 360 is switched on. |
Debug 360 Pro: Grouped view, stack traces and export
Debug 360 Pro replaces the free plugin and keeps your settings and log. To install it, go to Plugins → Add New → Upload Plugin, choose the Pro ZIP from your purchase email or the downloads page, and click Install Now. WordPress asks whether to replace the current plugin: click Replace current with uploaded. Then enter your license key under Debug 360 → License to receive updates.
Grouped view
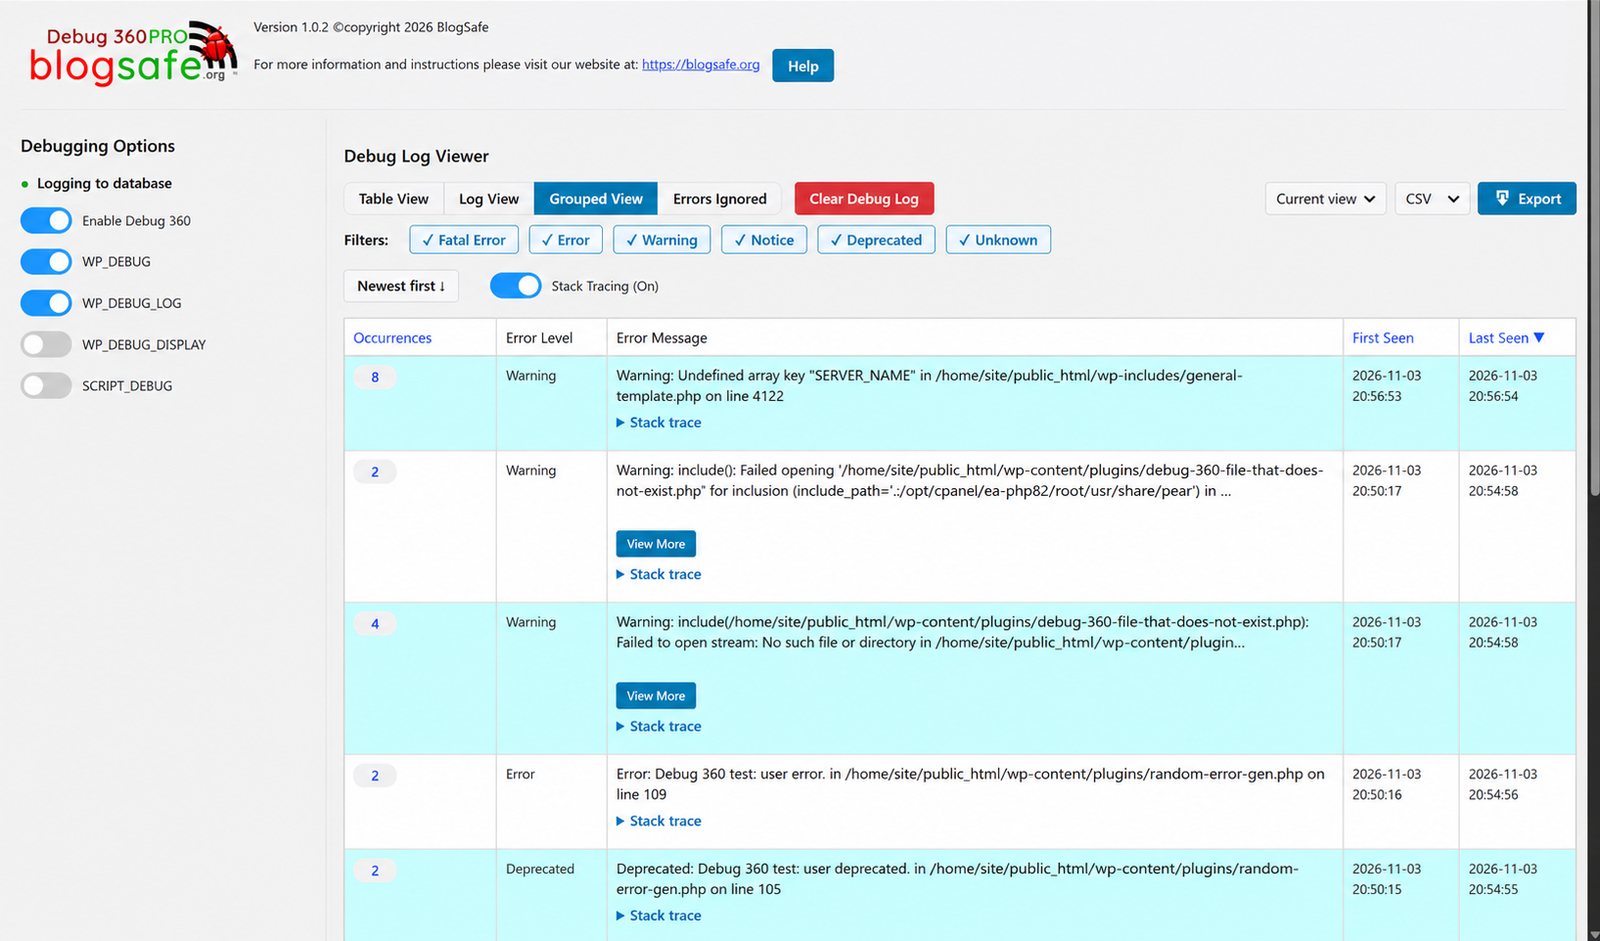
A busy site can log the same warning hundreds of times. Grouped View shows each distinct error once, with:
- Occurrences: how many times it has been logged;
- First Seen and Last Seen: when it started and when it last happened.
Errors are grouped by their message, file and line, so the same problem in the same place always lands in the same group. Click the Occurrences, First Seen or Last Seen heading to sort by it. The level filters work here too.
- View occurrences lists every individual entry in a group, newest first. Back to grouped errors returns to the list.
- Delete group deletes every occurrence of that error at once.
Where each error came from
Under each entry's message, Pro shows where the error happened:
- The kind of request: Cron, AJAX, REST API, WP-CLI, XML-RPC, Admin or Front end.
- Cron job: for errors from WordPress's scheduled tasks, the name of the job that was running. This works for fatal errors too, so you can see which job crashed, even one left behind by a plugin you removed long ago.
- Hooks: the WordPress hooks that were running, outermost first, for example
save_post > acf/save_post. These tell you what WordPress was doing when the error happened. - All errors from this page load: when one page load logged several errors, this link lists them all in the order they happened. The first one is often the cause of the rest. Back to the log returns to your view.
The Log View shows the same details on a Context: line under each entry, and exports include them. Entries imported from a debug.log, error.log or error_log file come from an earlier page load, so they don't have them.
Stack traces
A stack trace shows the chain of function calls that led to an error: which plugin called which function, and with what values. It's often the fastest way to find which plugin is really at fault.
Switch on Stack Tracing above the log, next to Syntax Highlighting. From then on, new errors are recorded with their stack trace. Read one by opening Stack trace under an entry in Table View or Grouped View, or below the entry in Log View.
Traces include the values passed to each function. These can contain passwords, API keys or customers' personal details. Debug 360 asks you to confirm before switching tracing on. Turn it on while you investigate a problem, and off again afterwards. Switching it off keeps traces already recorded; they're removed when their log entries are deleted.
To keep traces from slowing the site or filling the database, each one is limited:
- up to 20 traces per page load;
- up to 40 function calls per trace;
- long text values are cut to 500 characters, and each trace to 64 KB.
Traces never call your code: objects are listed by their properties, so recording a trace can't cause side effects.
Exporting the log
The export controls at the top right of the log viewer download entries as a file, for a developer or a support request. Choose the scope and the format, then click Export.
- Export format:
- CSV opens in a spreadsheet. Cells that start with
=,+,-,@, a tab or a carriage return are prefixed with', so a crafted error message can't run as a spreadsheet formula. - JSON suits scripts and AI assistants.
- Text is easy to read and paste.
- Export scope:
- Current view exports what you're looking at: the same view, level filters and sort order.
- All logs exports the whole log.
Only administrators can export. Exports can contain file paths and stack trace values, so store and share them carefully.
Pro settings
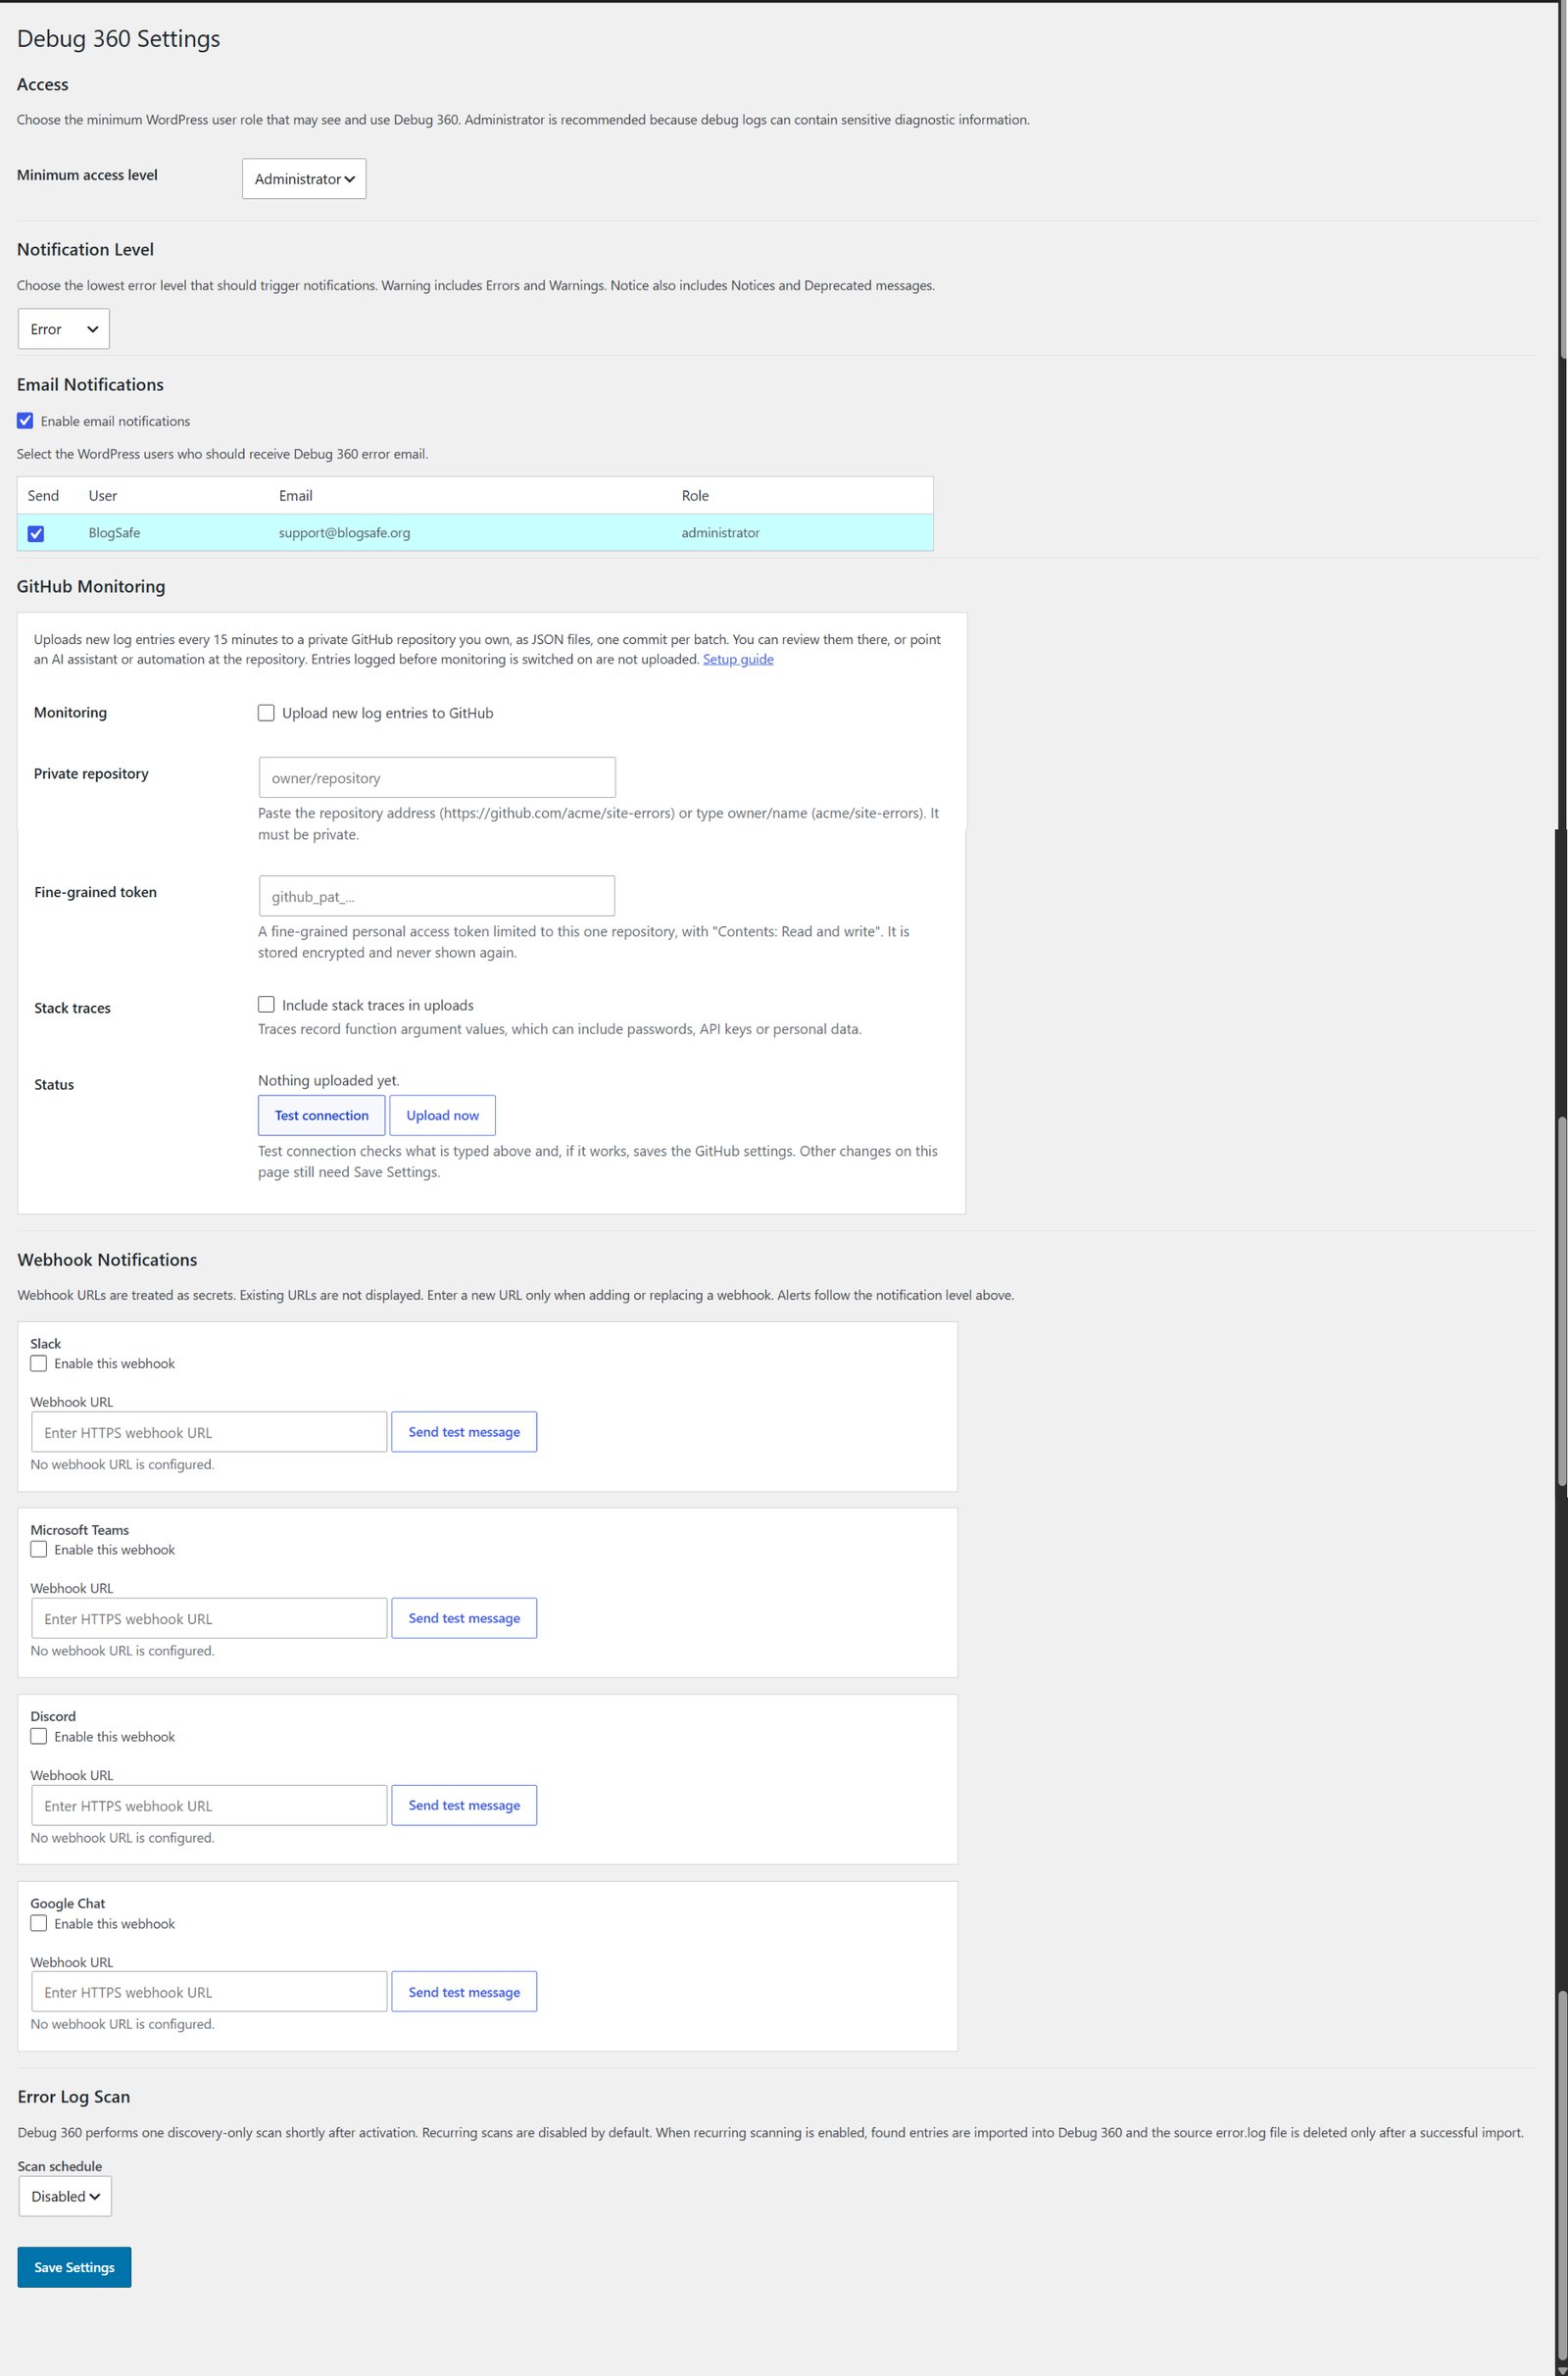
Pro adds two sections to Debug 360 → Settings, between Email Notifications and Error Log Scan:
- GitHub Monitoring: uploads new log entries to a private GitHub repository.
- Webhook Notifications: sends alerts to Slack, Microsoft Teams, Discord or Google Chat. They follow the same Notification Level as email alerts.
Everything else on the page works as in the free plugin.
Team alerts and GitHub Monitoring
Pro can also send alerts to Slack, Microsoft Teams, Discord or Google Chat, and upload new errors to a private GitHub repository for daily review by an AI assistant. Both are described in their own sections of this guide.
Debug 360 Pro: Team alerts (Slack, Microsoft Teams, Discord, Google Chat)
Debug 360 Pro can post an alert to a chat channel when your site logs an error. Each alert shows the error level, the error itself, the file and line it came from, the time and a link to the Debug 360 log. Server paths are shortened to start at your WordPress folder, and stack traces are never sent.
How alerts behave
- Which errors: alerts follow the Notification Level on the Settings page. "Error" sends errors and fatal errors only, "Warning" also sends warnings, and "Notice" sends everything with a level. Entries logged with plain
error_log()have no level and never alert. - No floods: the same error alerts at most once every 15 minutes, and one page load sends at most 10 alerts.
- No pings: in Discord, an error message containing
@everyone,@hereor a role mention does not notify anyone. - Status: under each webhook, the Settings page shows when the last message was delivered, or why it failed (the service's own reason).
Adding a webhook in Debug 360
- Get a webhook URL from your chat service (see below).
- In WordPress, go to Debug 360 → Settings → Webhook Notifications.
- Paste the URL into the service's Webhook URL box.
- Click Send test message. If the service accepts it, the webhook is saved and switched on, and a green "Test" message appears in your channel. If not, the reason is shown and nothing is saved.
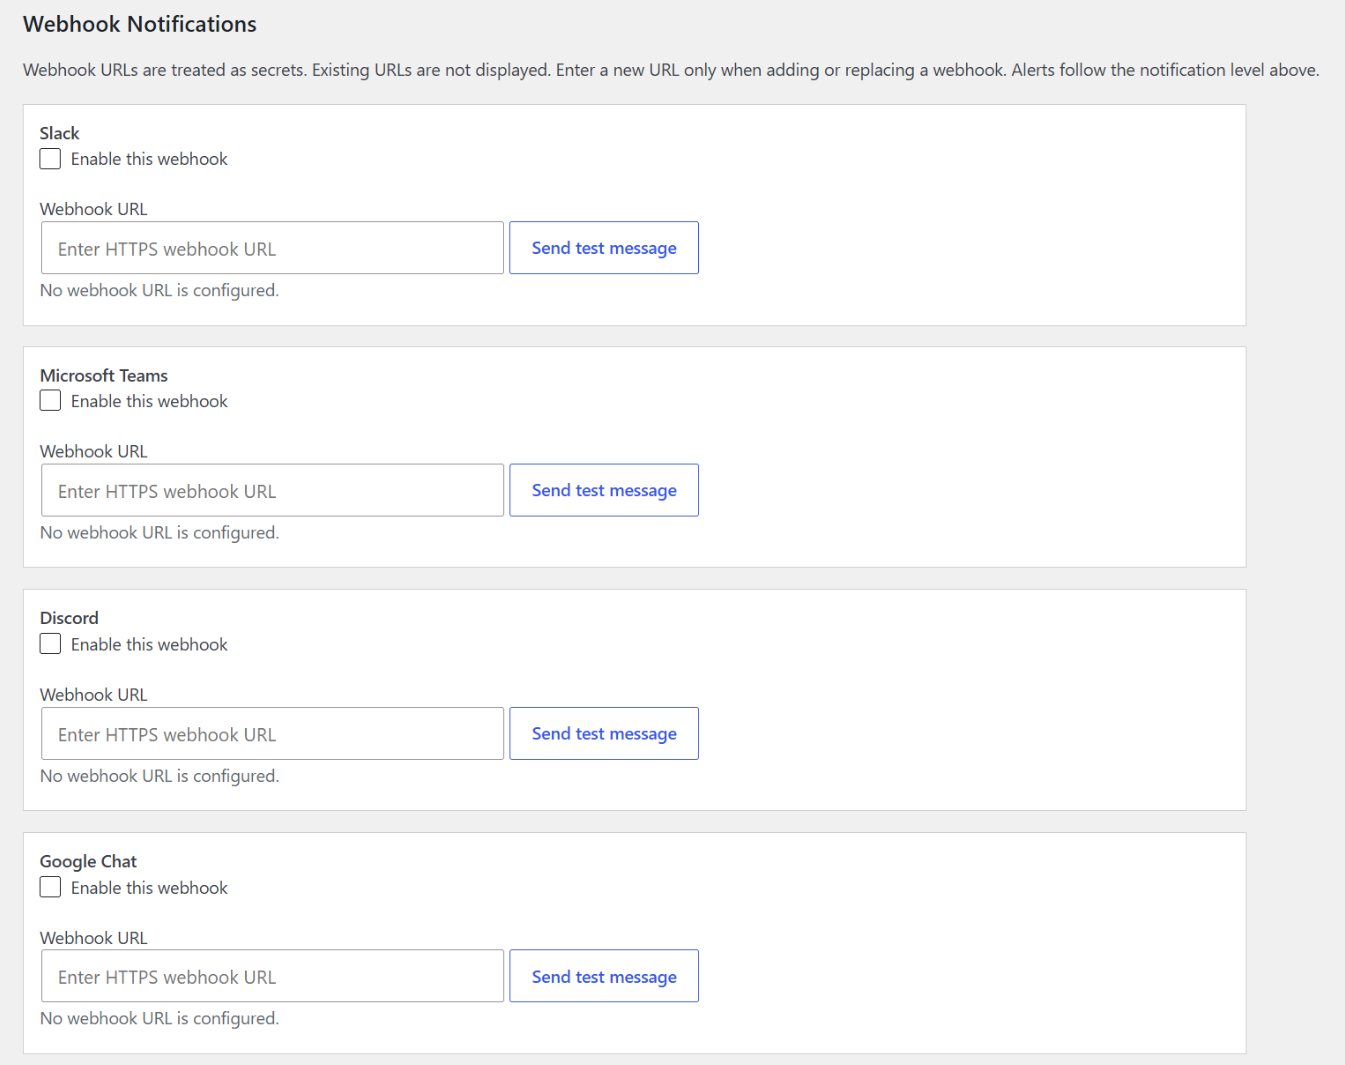
You can also tick Enable this webhook and click Save Settings, but the test button tells you straight away whether it works.
Webhook URLs work like passwords: anyone who has one can post to your channel. Debug 360 never shows a saved URL again. To replace one, paste the new URL and save; to stop alerts, untick Enable this webhook and save.
Discord
- In Discord, open Server Settings → Integrations → Webhooks. You need the Manage Webhooks permission.
- Click New Webhook, give it a name (for example "Debug 360") and choose the channel.
- Click Copy Webhook URL. It starts with
https://discord.com/api/webhooks/.
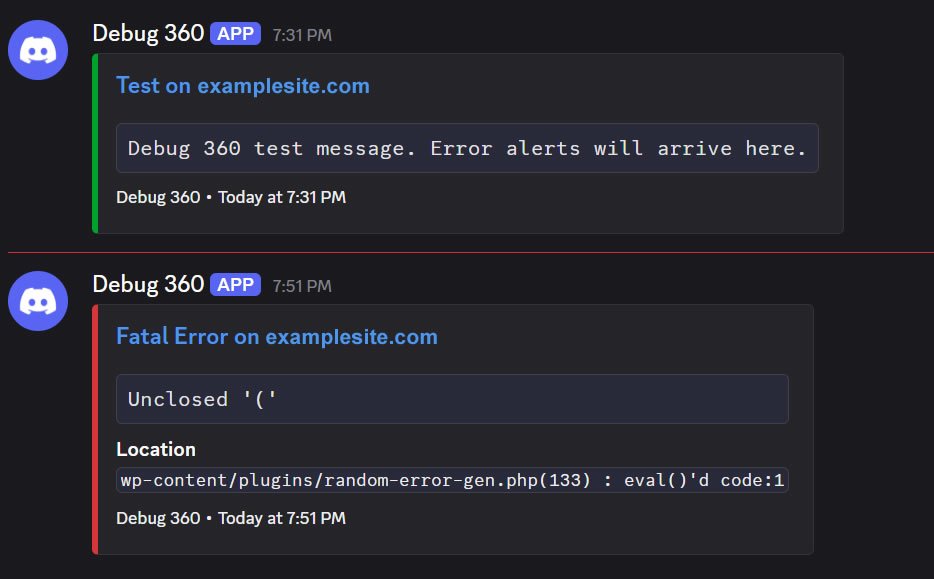
A test message (green) and a fatal error alert (red) in Discord:
Google Chat
Requires a Google Workspace account (business, education or similar). Personal Gmail accounts cannot add webhooks, and your Workspace administrator can turn them off.
- In Google Chat (chat.google.com, or Chat in Gmail), open the space that should receive alerts. Webhooks work in spaces, not in direct messages. To make a new space, click New chat → Create a space.
- Click the space name at the top, then Apps & integrations.
- Click Add webhooks (or Manage webhooks, then Add another).
- Enter a name, for example "Debug 360". The avatar URL is optional. Click Save.
- Click the More (⋮) button next to the new webhook and choose Copy link. The URL starts with
https://chat.googleapis.com/v1/spaces/and ends withkey=...&token=...; copy all of it.
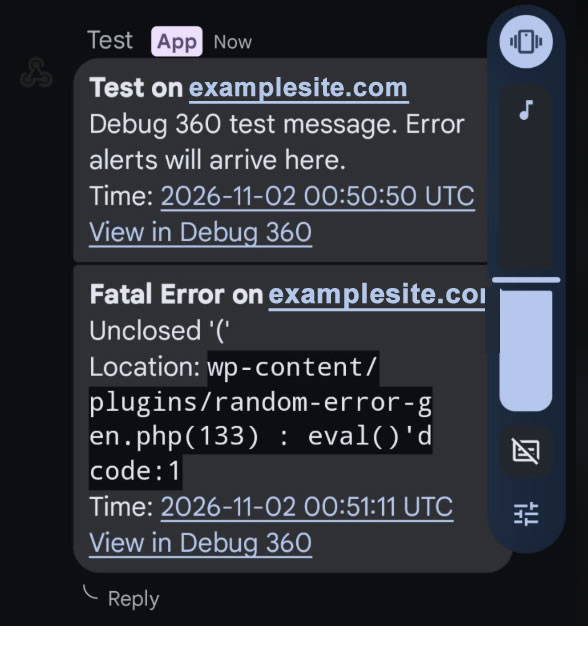
A test message and a fatal error alert in the Google Chat phone app:
If you don't see Apps & integrations or Add webhooks, or Chat says "Webhook management restricted", your account is a personal one or incoming webhooks are turned off for your organisation. A Workspace administrator can turn them on:
- Sign in to admin.google.com.
- Go to Apps → Google Workspace → Google Chat.
- Open Chat apps (in some consoles, Manage Chat apps).
- Turn on Allow users to add and use incoming webhooks and click Save.
The change usually applies within minutes but can take up to 24 hours. Reload Chat and try again.
Slack
- Go to api.slack.com/apps, click Create New App → From scratch, name it "Debug 360" and choose your workspace.
- Under Features, open Incoming Webhooks and turn Activate Incoming Webhooks on.
- Click Add New Webhook to Workspace, choose the channel and click Allow.
- Copy the URL. It starts with
https://hooks.slack.com/services/.
Microsoft Teams
Teams' old "Incoming Webhook" connectors are being retired; use a Workflow instead.
- In Teams, open the channel, click ⋯ (More options) → Workflows.
- Choose the template Post to a channel when a webhook request is received.
- Name it, confirm the team and channel, and click Add workflow.
- Copy the URL Teams shows. It usually starts with
https://and containslogic.azure.comorpowerplatform.com.
Older Teams connector URLs (containing webhook.office.com) still work while Microsoft supports them.
Troubleshooting
| Message | What to do |
|---|---|
| The webhook URL was not saved: it must be an https:// webhook address from that service. | You pasted a different address (for example your site's). Copy the webhook URL again from the service. |
| The service refused the message (HTTP 404). Unknown Webhook | The webhook was deleted in the chat service. Create a new one. |
| The service refused the message (HTTP 401/403) | The URL is incomplete or its token was reset. Copy the full URL again. |
| cURL error 28 … timed out | Your server couldn't reach the service. Try again; if it keeps happening, ask your host whether outgoing connections are blocked. |
| The test works but errors don't alert | Check the Notification Level, and remember the same error alerts only once every 15 minutes. |
GitHub Monitoring (Debug 360 Pro)
GitHub Monitoring copies new errors from your site's Debug 360 log into a private GitHub repository that you own. Once they are there, an AI assistant can check them once a day and send you a short report. You don't have to log in to WordPress, and you don't get an email for every warning.
It costs nothing beyond a free GitHub account and the AI assistant you already use.
How it works
- Debug 360 records PHP errors and warnings on your site, as usual.
- Every 15 minutes, if anything new has been logged, Debug 360 uploads those entries to your repository as one JSON file (one commit).
- Once a day, an AI assistant reads the new files and reports what needs attention.
Only entries logged after you switch GitHub Monitoring on are uploaded. Your existing log history stays on your site.
What you need
- Debug 360 Pro, with database logging switched on ("Enable Debug 360" in Debugging Options).
- A GitHub account. A free account is enough.
- About 10 minutes.
Step 1: Create a private repository
- Sign in at github.com and go to github.com/new.
- Owner: your account (or your organization).
- Repository name: anything you like, for example
mysite-errors. - Choose Private. Debug 360 refuses to upload to a public repository, because error messages contain details about your site.
- Tick Add a README file.
- Click Create repository.
Make a note of the owner and name. In the address https://github.com/acme/mysite-errors, that's acme/mysite-errors.
Step 2: Create a token for Debug 360
A fine-grained personal access token lets Debug 360 write to this one repository and nothing else.
- On GitHub, click your profile picture (top right), then Settings.
- At the bottom of the left menu, click Developer settings.
- Click Personal access tokens, then Fine-grained tokens, then Generate new token.
- Fill in:
- Token name: for example
Debug 360 - mysite.com. - Resource owner: the account or organization that owns the repository. - Expiration: choose a date. One year is a sensible choice. Put a reminder in your calendar to replace it before it expires (see "Replacing the token" below). - Repository access: choose Only select repositories, then select the repository from Step 1. - Permissions: open Repository permissions and set Contents to Read and write. GitHub adds "Metadata: Read-only" automatically. Leave everything else as "No access". - Click Generate token.
- Copy the token now. It starts with
github_pat_, and GitHub shows it only once.
If the repository belongs to an organization, the organization may need to approve the token first. It shows as "pending" until an organization owner approves it.
Step 3: Connect Debug 360
- In WordPress, go to Debug 360 → Settings and scroll to GitHub Monitoring.
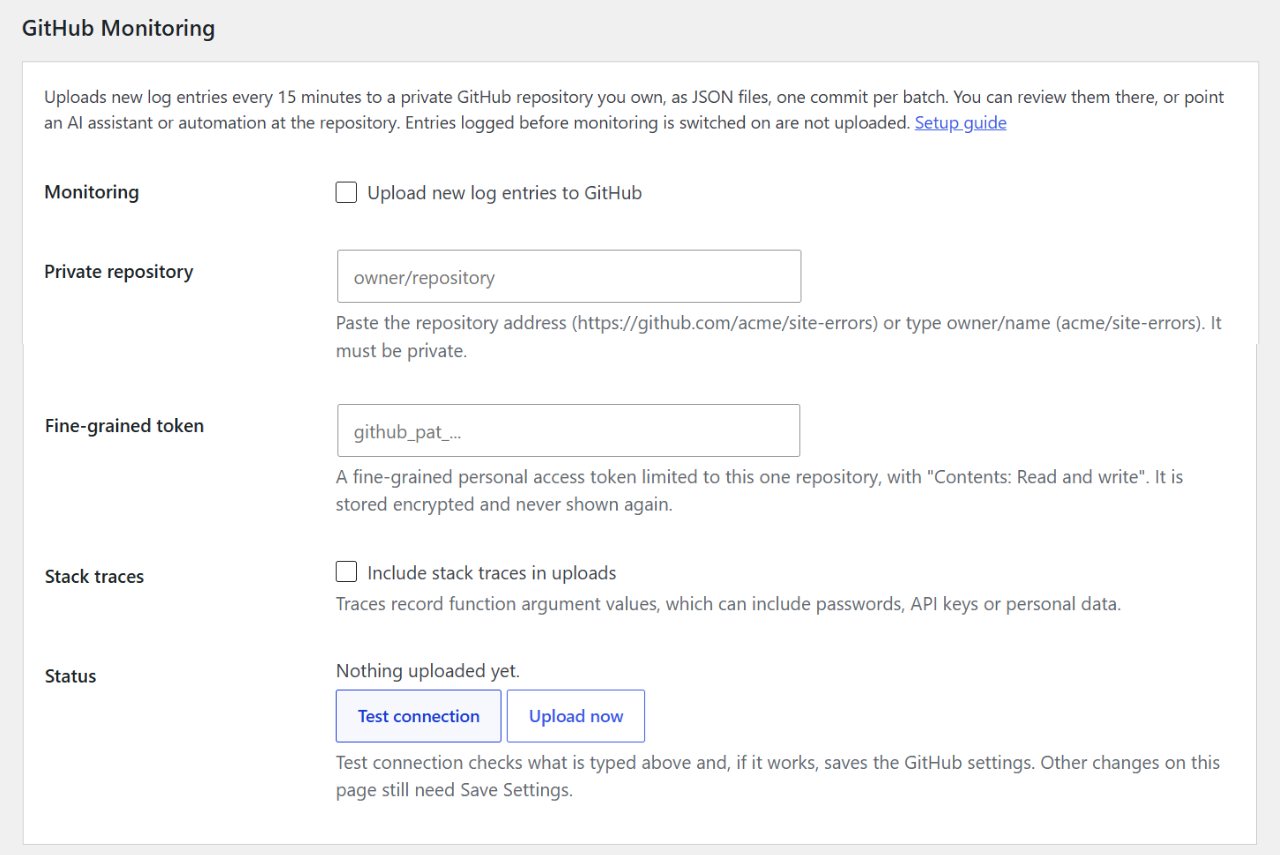
- Private repository: paste the repository's address from your browser (
https://github.com/acme/mysite-errors) or typeowner/name(acme/mysite-errors). Either works. - Fine-grained token: paste the token.
- Tick Upload new log entries to GitHub.
- Optional: tick Include stack traces in uploads (see "Privacy" before you do).
- Click Test connection. You should see: "Connected to acme/mysite-errors. It is private and the token can write to it. The repository and token are saved and monitoring is on." A successful test saves the GitHub settings for you. If you see something else, check "Troubleshooting" below; the repository stays in its field so you can correct it, but you'll need to paste the token again.
If you skipped step 4, the message says so: tick the box and click Save Settings. Test connection only saves the GitHub section; other changes on the page still need Save Settings.
The Status line then shows when the next upload is due. After the first upload it shows how many entries went up and the file they went to. Upload now sends any new entries straight away instead of waiting.
Step 4: Set up the daily AI review
Any AI assistant that can read a private GitHub repository on a schedule can do this. Examples include a scheduled task in Claude or ChatGPT with their GitHub connector, or an automation you already use. The general steps:
- Give the assistant read access to the repository. Use its GitHub connector or integration, and allow it only this repository if it asks. It doesn't need the token from Step 2; that one belongs to Debug 360.
- Create a daily scheduled task with a prompt like this:
Read the files added under
incoming/in the GitHub repository acme/mysite-errors in the last 24 hours. Using each file'ssummary, report: any Fatal Error or Error (with the message, file and line, and how often); any error that is new compared with the previous seven days; and any warning that occurred more than 50 times. Group repeats together, say which plugin or theme each one comes from (from the file path), and suggest a likely cause. If nothing needs attention, say so in one line.
- Choose how you want the report: in the assistant, or by email or notification if your assistant offers it.
Debug 360 also writes a file called DEBUG-360.md to the top of the repository with its first upload. It describes the file format and includes the same suggested prompt, so an assistant pointed at the repository can work out the layout for itself.
What gets uploaded
Files go to:
incoming/<your site>/<date>/<date-time>-<first entry>-<last entry>.json
For example incoming/mysite-com/2026-11-01/20261101-204930-2-4.json. Dates and times in the path are UTC.
Each file looks like this:
{
    "format": "debug-360/github-v1",
    "site": {
        "url": "https://mysite.com/",
        "name": "My Site",
        "wordpress": "7.1.4",
        "php": "8.2.35",
        "debug_360": "1.0.2",
        "timezone": "Europe/London"
    },
    "uploaded_at": "2026-11-01T20:49:30+00:00",
    "summary": {
        "entries": 3,
        "levels": { "Warning": 2, "Fatal Error": 1 },
        "errors": [
            {
                "group": "5c141e63813d353d612fff7b156e815c",
                "level": "Warning",
                "count": 2,
                "first_seen": "2026-11-01 20:49:30",
                "last_seen": "2026-11-01 20:49:30",
                "example": "Warning: Undefined variable $x in wp-content/plugins/demo/demo.php on line 12"
            }
        ]
    },
    "entries": [
        {
            "id": 2,
            "time": "2026-11-01 20:49:30",
            "level": "Warning",
            "message": "Warning: Undefined variable $x in wp-content/plugins/demo/demo.php on line 12",
            "group": "5c141e63813d353d612fff7b156e815c"
        }
    ]
}
summary.levelscounts entries by level.summary.errorslists each distinct error once, most frequent first. The same message from the same file and line shares agroup, which stays the same from one upload to the next, so repeats are easy to track.entrieshas every individual entry.timeis in your site's time zone.request_type,hooksandrequestsay where an entry came from: the kind of request (cron,ajax,rest,cli,xmlrpc,adminorfront), the WordPress hooks that were running (in a cron request the first is the cron job), and an ID shared by every error from the same page load. They're left out for entries imported from a log file.stack_traceappears on an entry only if you switched stack traces on.
Limits: up to 500 entries per file and 4 files per run, so up to 2,000 entries every 15 minutes. If more are waiting, they go up on the next run. Nothing is skipped.
Privacy and security
- Private repositories only. Debug 360 checks that the repository is private and won't upload otherwise.
- Shorter file paths. Your server's folder path to WordPress is removed, so
/home/account/public_html/wp-content/plugins/x.phpis uploaded aswp-content/plugins/x.php. - Stack traces are off by default. If you switch them on, they include the values passed to functions, which can contain passwords, API keys or personal data.
- The token is stored encrypted in your WordPress database, using your site's secret keys from
wp-config.php. It's never shown again in the settings. If those secret keys change, enter the token again. - The token can only write to the one repository you selected in Step 2.
- Nothing else is sent. Debug 360 talks only to GitHub's API (
api.github.com), and only to upload log entries and check the connection.
Replacing the token
When the token expires or you revoke it, the Status line shows "GitHub rejected the token". New entries are kept and uploaded once a working token is saved, as long as they're still in your Debug 360 log.
- Create a new token (Step 2).
- Paste it into Fine-grained token and click Save Settings. You don't need to re-enter anything else.
To stop using a token, delete it on GitHub (Developer settings → Personal access tokens → Fine-grained tokens), and tick Remove saved token in Debug 360.
Turning it off or changing repository
- Turn off: untick Upload new log entries to GitHub and save. Uploads stop; nothing is deleted from GitHub.
- Change repository: enter the new
owner/name, give the token access to it (or create a new token), and save. Uploading to the new repository starts from that moment. - Files already uploaded stay in GitHub until you delete them or the repository.
Uploads depend on site visits
WordPress runs scheduled jobs, including these uploads, when someone visits your site. On a quiet site, uploads may happen less often than every 15 minutes. If your host lets you, set up a real cron job that calls wp-cron.php every 5–15 minutes. Your host's control panel or support can help.
Troubleshooting
| Message | What to do |
|---|---|
| GitHub rejected the token. It may be mistyped, expired or revoked. | Copy the token again, or create a new one (Step 2). |
| Repository not found. Check the owner/name, and that the token was given access to this repository. | Check the spelling, and that the token's Repository access includes this repository. |
| The token is not allowed to do this. Give it "Contents: Read and write" access to the repository. | Edit the token on GitHub: Repository permissions → Contents → Read and write. |
| The token can read this repository but not write to it. | Same as above. |
| This repository is public. | Make it private (repository Settings → General → Danger Zone → Change visibility) or use another repository. |
| Enter the repository as owner/name. | Paste the address of the repository itself (https://github.com/owner/name) or type owner/name. Your website's address won't work. |
| Could not reach GitHub: … | Your server couldn't connect to api.github.com. Ask your host whether outgoing connections are blocked. |
| Token shows as "pending" on GitHub | An organization owner needs to approve the token. |
| Nothing uploaded yet | Uploads only happen when there are new entries. Click Upload now to check straight away. |